Inventory Analysis: KPIs, Methods, and Optimization

Analyzing inventory and logistics processes is essential to ensuring business performance. Without an analysis method and regular monitoring of key performance indicators (KPIs), a company risks losing revenue and jeopardizing its operations. But which methods and KPIs should you track? We explain everything below.
Inventory Analysis: The ABC Method
Inventory management and forecasting methods are useful not only for your marketing strategies but also for preventing product waste, overstocking, and stockouts. If you do not have a clear picture of the quantities stored in your warehouses, the value of your products may decrease, for example, due to potential waste. This highlights the importance of prioritizing inventory based on urgency, taking into account its shelf life and its contribution to your company’s success.

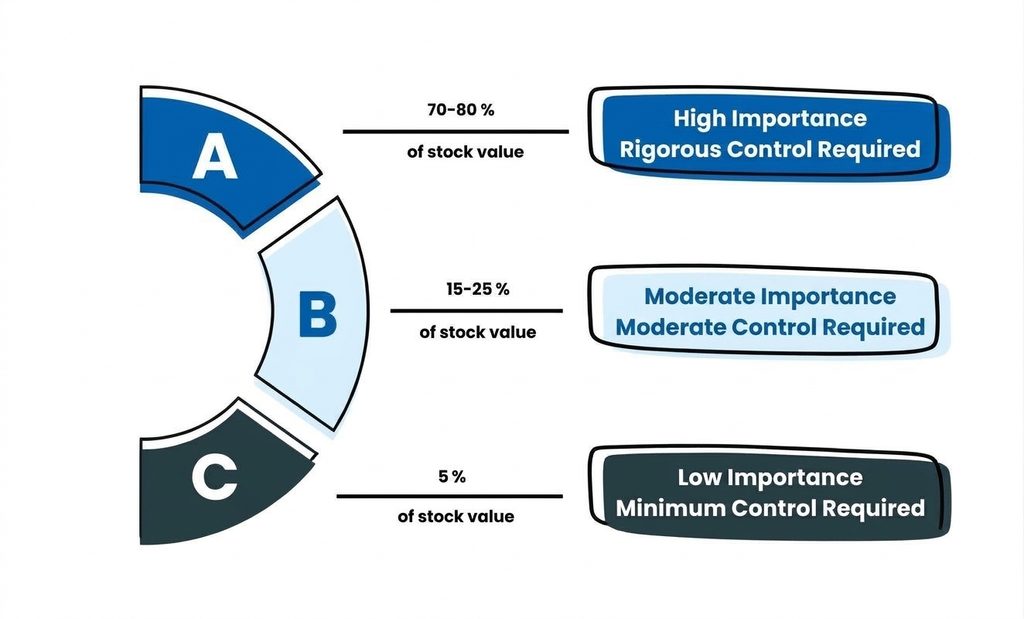
The ABC method is an inventory control system that allows you to classify products according to their individual value. From a qualitative perspective, the different categories are generally classified as follows:
- Class A: These are the products considered the most valuable and those that contribute the most to your revenue.
- Class B: These are high-value products, but they do not represent the company’s main source of revenue.
- Class C: These are the products with the lowest contribution to business performance.
In quantitative terms, the categories are classified as follows:
- Class A: 20% of items account for 70% of the company’s annual consumption.
- Class B: 30% of products account for 25% of the company’s annual consumption.
- Class C: 50% of products account for 5% of the company’s annual consumption.
By dividing and classifying products into three categories, a company can analyze and understand how its products perform and which ones drive growth. This data also provides insights into consumer behavior and purchasing habits…
Inventory Analysis: Essential KPIs to Track
A key performance indicator (KPI) helps monitor inventory, the inflow and outflow of goods, and stock availability. KPIs simplify decision-making by helping optimize logistics planning and inventory control based on actual warehouse performance. As you can see, closely monitoring KPIs increases the productivity and efficiency of your facility. Here are the key KPIs to track.
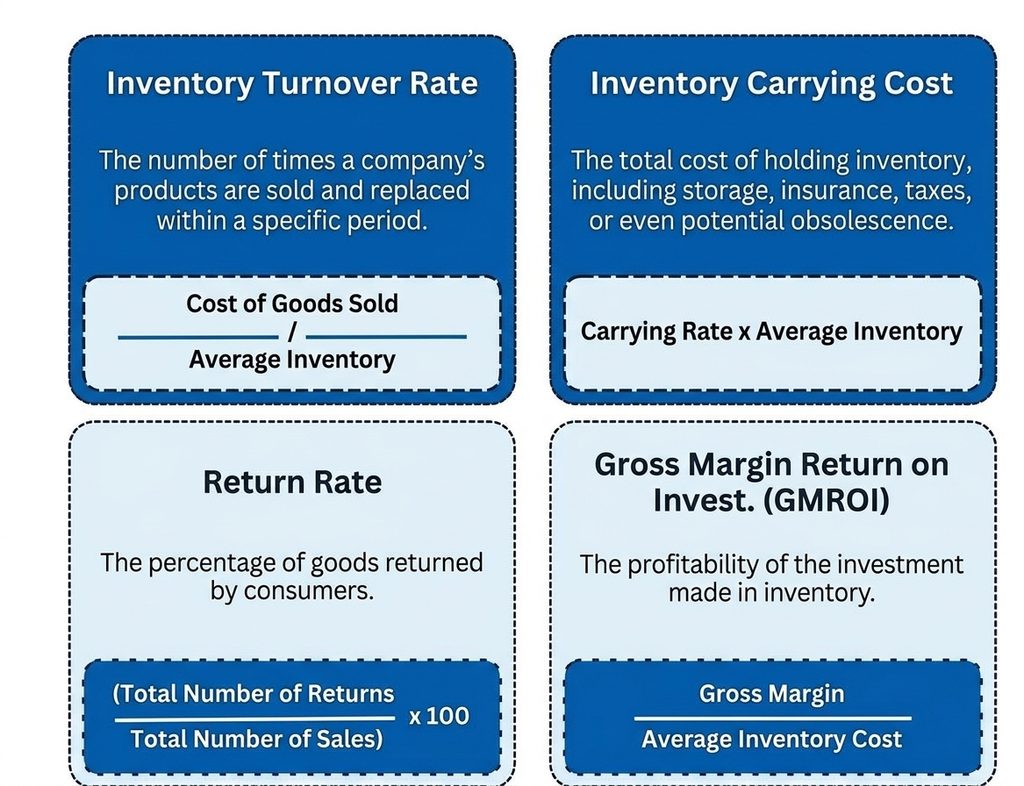
Inventory Turnover Rate
This KPI measures how many times a company’s products are sold and replenished over a specific period (usually one year). A high inventory turnover rate indicates efficient inventory management and strong product demand. A low rate may indicate overstocking or obsolete products.
Here is the formula:
Inventory Turnover Rate = Cost of Goods Sold / Average Inventory.
Inventory Carrying Cost
This is the total cost of holding inventory, including storage, taxes, insurance, and any loss in value due to obsolescence. By monitoring inventory carrying costs, a company can identify storage inefficiencies and assess the profitability of its inventory.
You can use the following formula:
Inventory Carrying Cost = Carrying Cost Rate × Average Inventory.
The carrying cost rate corresponds to the storage costs of inventory held in stock, plus the costs of financing that inventory.
Return Rate
This measures the percentage of goods returned by customers. A high return rate may indicate a product quality issue or a mismatch between the product and customer expectations. Monitoring this KPI helps improve customer satisfaction and reduce the costs associated with processing returns.
Here is the formula for the return rate:
Return Rate = (Total Number of Returns / Total Number of Sales) × 100.
Gross Margin Return on Investment (GMROI)
This KPI measures the profitability of inventory investment. It allows you to assess how effectively your company converts inventory purchases into gross margin.
A high GMROI indicates that inventory purchasing decisions are effective. Conversely, a low GMROI points to inefficiencies or unprofitable inventory.
Here is the formula:
GMROI = Gross Margin / Average Inventory Cost
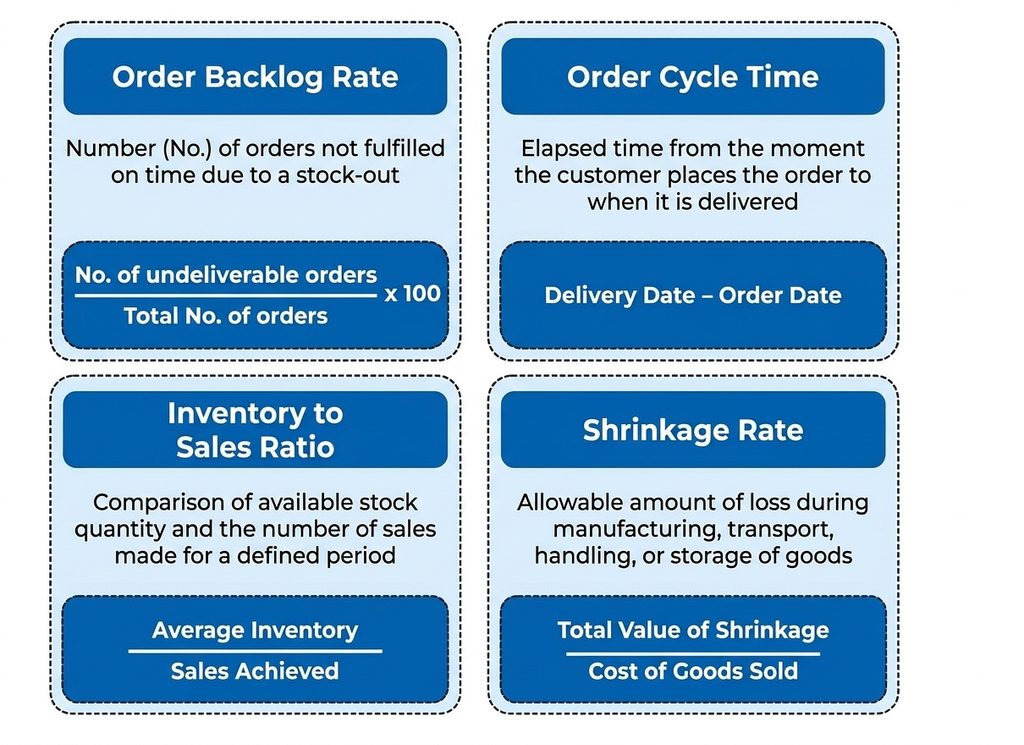
Backorder Rate
This measures the number of orders that cannot be fulfilled on time due to a lack of stock. This KPI tracks stockouts, which can affect customer satisfaction. A high backorder rate likely indicates that inventory levels are inadequate or that there are issues with demand forecasting.
Conversely, a low backorder rate is ideal, as it means that most orders are fulfilled quickly.
Here is the formula:
Backorder Rate = (Number of Unfulfillable Orders / Total Number of Orders) × 100
Order Cycle Time
Order cycle time is the time elapsed between the moment a customer places an order and the moment it is delivered.
Here is the formula:
Delivery Date − Order Date
This gives you a clear picture of the efficiency of your order processing and fulfillment processes.
A shorter order cycle improves customer satisfaction because customers receive their orders more quickly. Analyzing this KPI helps you identify bottlenecks in the supply chain or fulfillment processes. This makes it easier to implement measures to improve delivery times.
Stock-to-Sales Ratio
Here, you compare the quantity of inventory available with the number of sales made over a defined period. This helps you determine whether your inventory levels are too high relative to your sales.
A high ratio means that the company may be holding excess inventory, unnecessarily tying up capital. Conversely, a low ratio may indicate potential stockouts. In short, monitoring this KPI helps you maintain an optimal inventory level in line with the company’s sales rate.
The stock-to-sales ratio is calculated as follows:
Stock-to-Sales Ratio = Inventory Value / Sales Value.
Inventory Shrinkage Rate
In logistics, shrinkage refers to the tolerated level of goods loss during manufacturing, transportation, handling, or storage. Some goods and inventory items naturally decrease in quantity due to their nature or packaging, without being used, consumed, or sold. Shrinkage is generally identified during audits and physical inventory counts.
By monitoring this KPI, you can identify the causes of inventory shrinkage and implement preventive measures to reduce it.
The shrinkage rate is calculated as follows:
Shrinkage Rate = Total Shrinkage Value / Cost of Goods Sold
Inventory Analysis: Using Inventory Management Software to Optimize Sales
To achieve maximum efficiency, you need to regularly analyze your inventory and logistics processes based on predefined KPIs. This allows you to maintain an accurate, up-to-date understanding of your warehouse’s actual performance.
To ensure effective inventory analysis, the best approach is to use inventory management software. Logistiqa, an ERP solution designed for very small, small, and medium-sized businesses (VSBs and SMEs), supports you in managing your inventory, purchases, and sales. It helps you better organize your operations, monitor your business activities, and make informed decisions to improve your company’s performance.
Contact us by email info@logistiqa.co